Severe flooding induced by Hurricane Sandy in 2012
Coastal floods induced by hurricane storm surge are some of the frequent, costly, and deadly hazards that can affect coastal communities. Hurricane Sandy was the deadliest and most destructive hurricane of the 2012 Atlantic hurricane season, as well as the second-costliest hurricane in United States history. The storm surge hit the East Coast of the United States. Thousands of kilometers of coastline were affected, and huge economic losses occurred.
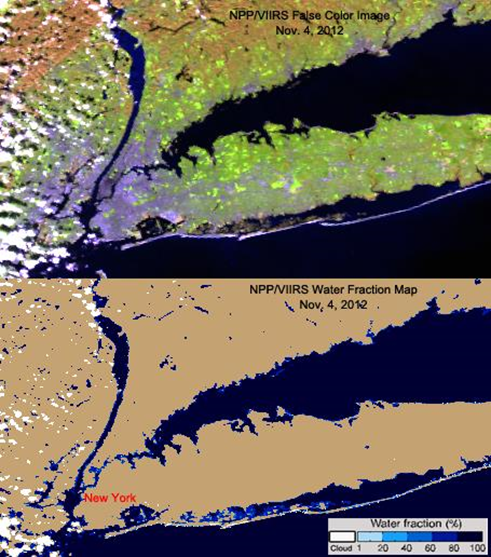
The Visible Infrared Imaging Radiometer Suite (VIIRS) onboard the NPP satellite captured the top image, and the bottom flood map derived from VIIRS on November 4, 2012.
 VIIRS false color image and flood detection map on November 4, 2012
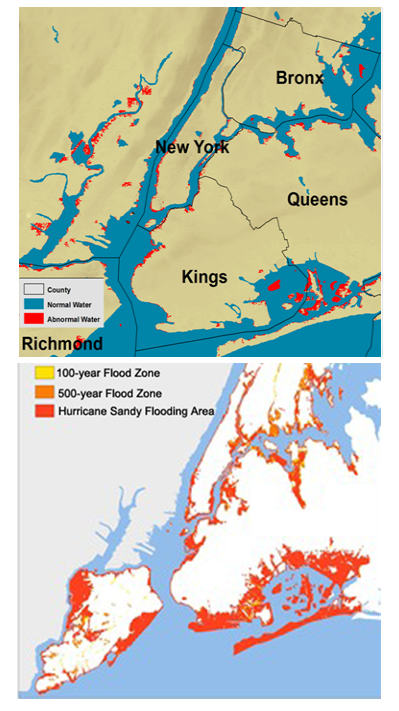
With the original spatial resolution 375 m of VIIRS, the flooded area in small regions, like New York, during Hurricane Sandy period, can't be detected. By applying an inundation model recently developed by our group (Li et al., 2013) and ingesting DEM data from the SRTM, flood maps derived from VIIRS can be upgraded to 30 m resolution.

Compared with flooding zone maps from the FEMA and evacuation estimates during Hurricane Sandy, the VIIRS 30-m flood map on Nov. 4th, 2012 shows consistent inundated locations. Nevertheless, the flood map derived from VIIRS shows less inundated area than the FEMA flood map and the ground observations. This is because most flooding water due to Sandy already receded on Nov. 4th, 2012.
Since microwave instruments, like Radar and ATMS, can penetrate through clouds to observe the Earth surface, but the Radar data is usually very expensive, we therefore developed a new method to derive flood maps from passive microwave ATMS observations.
More detailes can be found from our paper Mapping floods due to Hurricane Sandy using NPP VIIRS and ATMS data and geotagged Flickr imagery
References
U.S. Army Corps of Engineers. (2011, July 11). Corps: June 2011 was highest single month of runoff into Missouri River basin. (PDF file) Accessed July 19, 2011.
National Weather Service. Advanced Hydrologic Prediction Service. Accessed July 19, 2011.
- Instrument:
- NPP - VIIRS - ATMS